
Calculate Your Lithium Forklift Battery ROI: When Will You Break Even?
Calculate exactly when your lithium forklift battery investment will pay off. Our interactive ROI tool reveals your timeline.

When warehouse and operations managers first see the price tag on lithium forklift batteries—typically $17,000-$25,000 compared to lead-acid alternatives at $2,000-$6,000—the immediate question is: "When will this investment pay off?"
It's a critical question that deserves a data-driven answer. Based on hundreds of warehouse conversions, our data consistently shows that multi-shift operations typically achieve ROI within 36 months for lead-acid conversions and just 24 months for IC conversions.
Consider the real-world example of a Texas-based 3PL operation with 50 Class 1 electric forklifts. After converting to lithium power, they documented savings of approximately $2.9 million—56% of their previous power system costs—over an eight-year period, with break-even achieved at 31 months.
But every operation is unique. Your specific ROI timeline depends on your operational profile, which is why we've developed a comprehensive ROI calculator to provide precise projections tailored to your facility.
Our Interactive ROI Calculator: How It Works

Our ROI calculator goes far beyond simple payback period calculations. This sophisticated tool analyzes your specific operational parameters to generate a detailed projection of both direct cost savings and indirect operational benefits.
The assessment process involves:
- Data Collection: We gather information about your current fleet, operational patterns, energy costs, and facility constraints.
- Comprehensive Analysis: Our specialists input this data into our proprietary calculator, which models multiple scenarios and variables.
- Custom Reporting: You receive a detailed report showing projected savings, break-even timeline, and long-term financial impact.
- Implementation Planning: For operations ready to move forward, we create a phased transition plan that minimizes disruption.
The result is a precise ROI projection that accounts for all relevant factors affecting your specific operation—not just a generic estimate based on industry averages.
Key ROI Calculator Components
To accurately determine your specific ROI timeline, our calculator incorporates these key variables:
Fleet Composition and Utilization
- Number and types of forklifts (reach trucks, counterbalance, order pickers, etc.)
- Hours of operation per day for each unit
- Current power source (lead-acid, propane, diesel, etc.)
- Age and replacement cycle of existing equipment
Energy Costs
- Local electricity rates including demand charges
- Fuel costs for IC equipment
- Charging efficiency of current battery systems
- Peak vs. off-peak energy usage patterns
Labor Expenses
- Hourly labor rates for operators and maintenance personnel
- Time spent on battery maintenance, swapping, or refueling
- Productivity losses during power-related downtime
- Training requirements for battery handling
Facility Considerations
- Cost per square foot of your warehouse space
- Current allocation for battery rooms, charging areas, or fuel storage
- Ventilation requirements and associated costs
- Potential for space repurposing after conversion
Operational Patterns
- Number of shifts per day
- Seasonal variations in activity
- Peak demand periods
- Opportunity for charging during breaks or shift changes
Environmental Factors
- Temperature extremes in operating environment
- Regulatory compliance requirements
- Corporate sustainability goals
- Indoor air quality considerations
By inputting your specific data points into these categories, our calculator generates a customized ROI projection that accounts for both direct cost savings and indirect operational benefits. This approach provides a much more accurate timeline than simplified calculations that focus solely on equipment costs.

Real-World ROI Scenarios
To illustrate how these factors combine in real-world scenarios, let's examine several common operational profiles and their typical ROI timelines:
IC to Lithium Conversion (24-month ROI)
Consider a distribution center operating 15 propane forklifts across two shifts:
Initial Investment:
- 15 lithium battery systems @ $18,000 each: $270,000
- Charging infrastructure installation: $30,000
- Total investment: $300,000
Annual Savings:
- Propane fuel elimination: $67,500 ($4,500 per truck)
- Maintenance reduction: $45,000 ($3,000 per truck)
- Productivity improvement: $54,000 (15 minutes saved daily per truck @ $30/hour)
- Emissions compliance: $15,000 (reduced ventilation requirements)
- Total annual savings: $181,500
ROI Calculation:
$300,000 ÷ $181,500 = 1.65 years (approximately 20 months)
Lead-Acid to Lithium Conversion (36-month ROI)
Now consider a warehouse with 20 electric reach trucks operating three shifts:
Initial Investment:
- 20 lithium battery systems @ $15,000 each: $300,000
- Charging infrastructure upgrades: $25,000
- Less: Value of sold lead-acid batteries: -$40,000 (40 batteries @ $1,000 each)
- Total net investment: $285,000
Annual Savings:
- Battery replacement cycle: $26,667 (40 lead-acid batteries @ $4,000 each, replaced every 3 years)
- Maintenance labor: $31,200 (15 minutes daily per battery @ $25/hour)
- Energy efficiency: $12,000 (20% reduction in electricity consumption)
- Battery room repurposing: $36,000 (400 sq ft @ $90/sq ft annual value)
- Productivity gains: $78,000 (30 minutes saved daily per truck @ $30/hour)
- Total annual savings: $183,867
ROI Calculation:
$285,000 ÷ $183,867 = 1.55 years (approximately 19 months)
Cold Storage Operation Example
Cold storage facilities see particularly compelling ROI because lead-acid batteries lose 30-50% of their capacity in freezer environments, while lithium batteries maintain 95% of rated capacity even in sub-freezing conditions.
A frozen food distribution center with 12 reach trucks operating in a -20°F environment achieved ROI in just 17 months, primarily due to:
- Elimination of heated battery rooms (significant energy savings)
- Reduced battery replacements (lead-acid batteries failed frequently in cold conditions)
- Increased productivity (no performance degradation during shifts)
- Reduced HVAC load (lithium batteries generate less heat)
Multi-Shift Warehouse Example
A large e-commerce fulfillment center with 80 forklifts operating 24/7 documented $4.2 million in operational expense reduction over 5 years after converting to lithium power. Their accelerated 22-month ROI was driven by:
- Elimination of battery changing rooms (repurposed for additional picking locations)
- Reduced labor costs for battery maintenance and exchange
- Decreased downtime during peak seasons
- Lower electricity consumption through more efficient charging
- Extended equipment lifecycle due to consistent power delivery
The ROI Formula Explained
While the basic ROI formula (Investment ÷ Annual Savings = Years to ROI) provides a useful starting point, our comprehensive calculator incorporates additional factors such as:
- Time value of money and financing costs
- Projected energy price increases
- Labor cost inflation
- Productivity improvements over time as operators adapt to new technology
- Potential tax incentives or rebates for clean energy investments
These sophisticated projections provide a more accurate picture of your expected financial returns beyond the simple payback period.
For most operations, the ROI timeline follows a predictable pattern:
- Months 1-6: Initial adjustment period with modest productivity gains
- Months 7-18: Accelerating savings as operational efficiencies are realized
- Months 19-36: Break-even point typically achieved
- Years 4-10: Continued savings with minimal additional investment
Our calculator generates a visual timeline showing the progression from initial investment to net positive returns, allowing you to clearly see when your operation will achieve ROI.

Beyond Direct Cost Savings
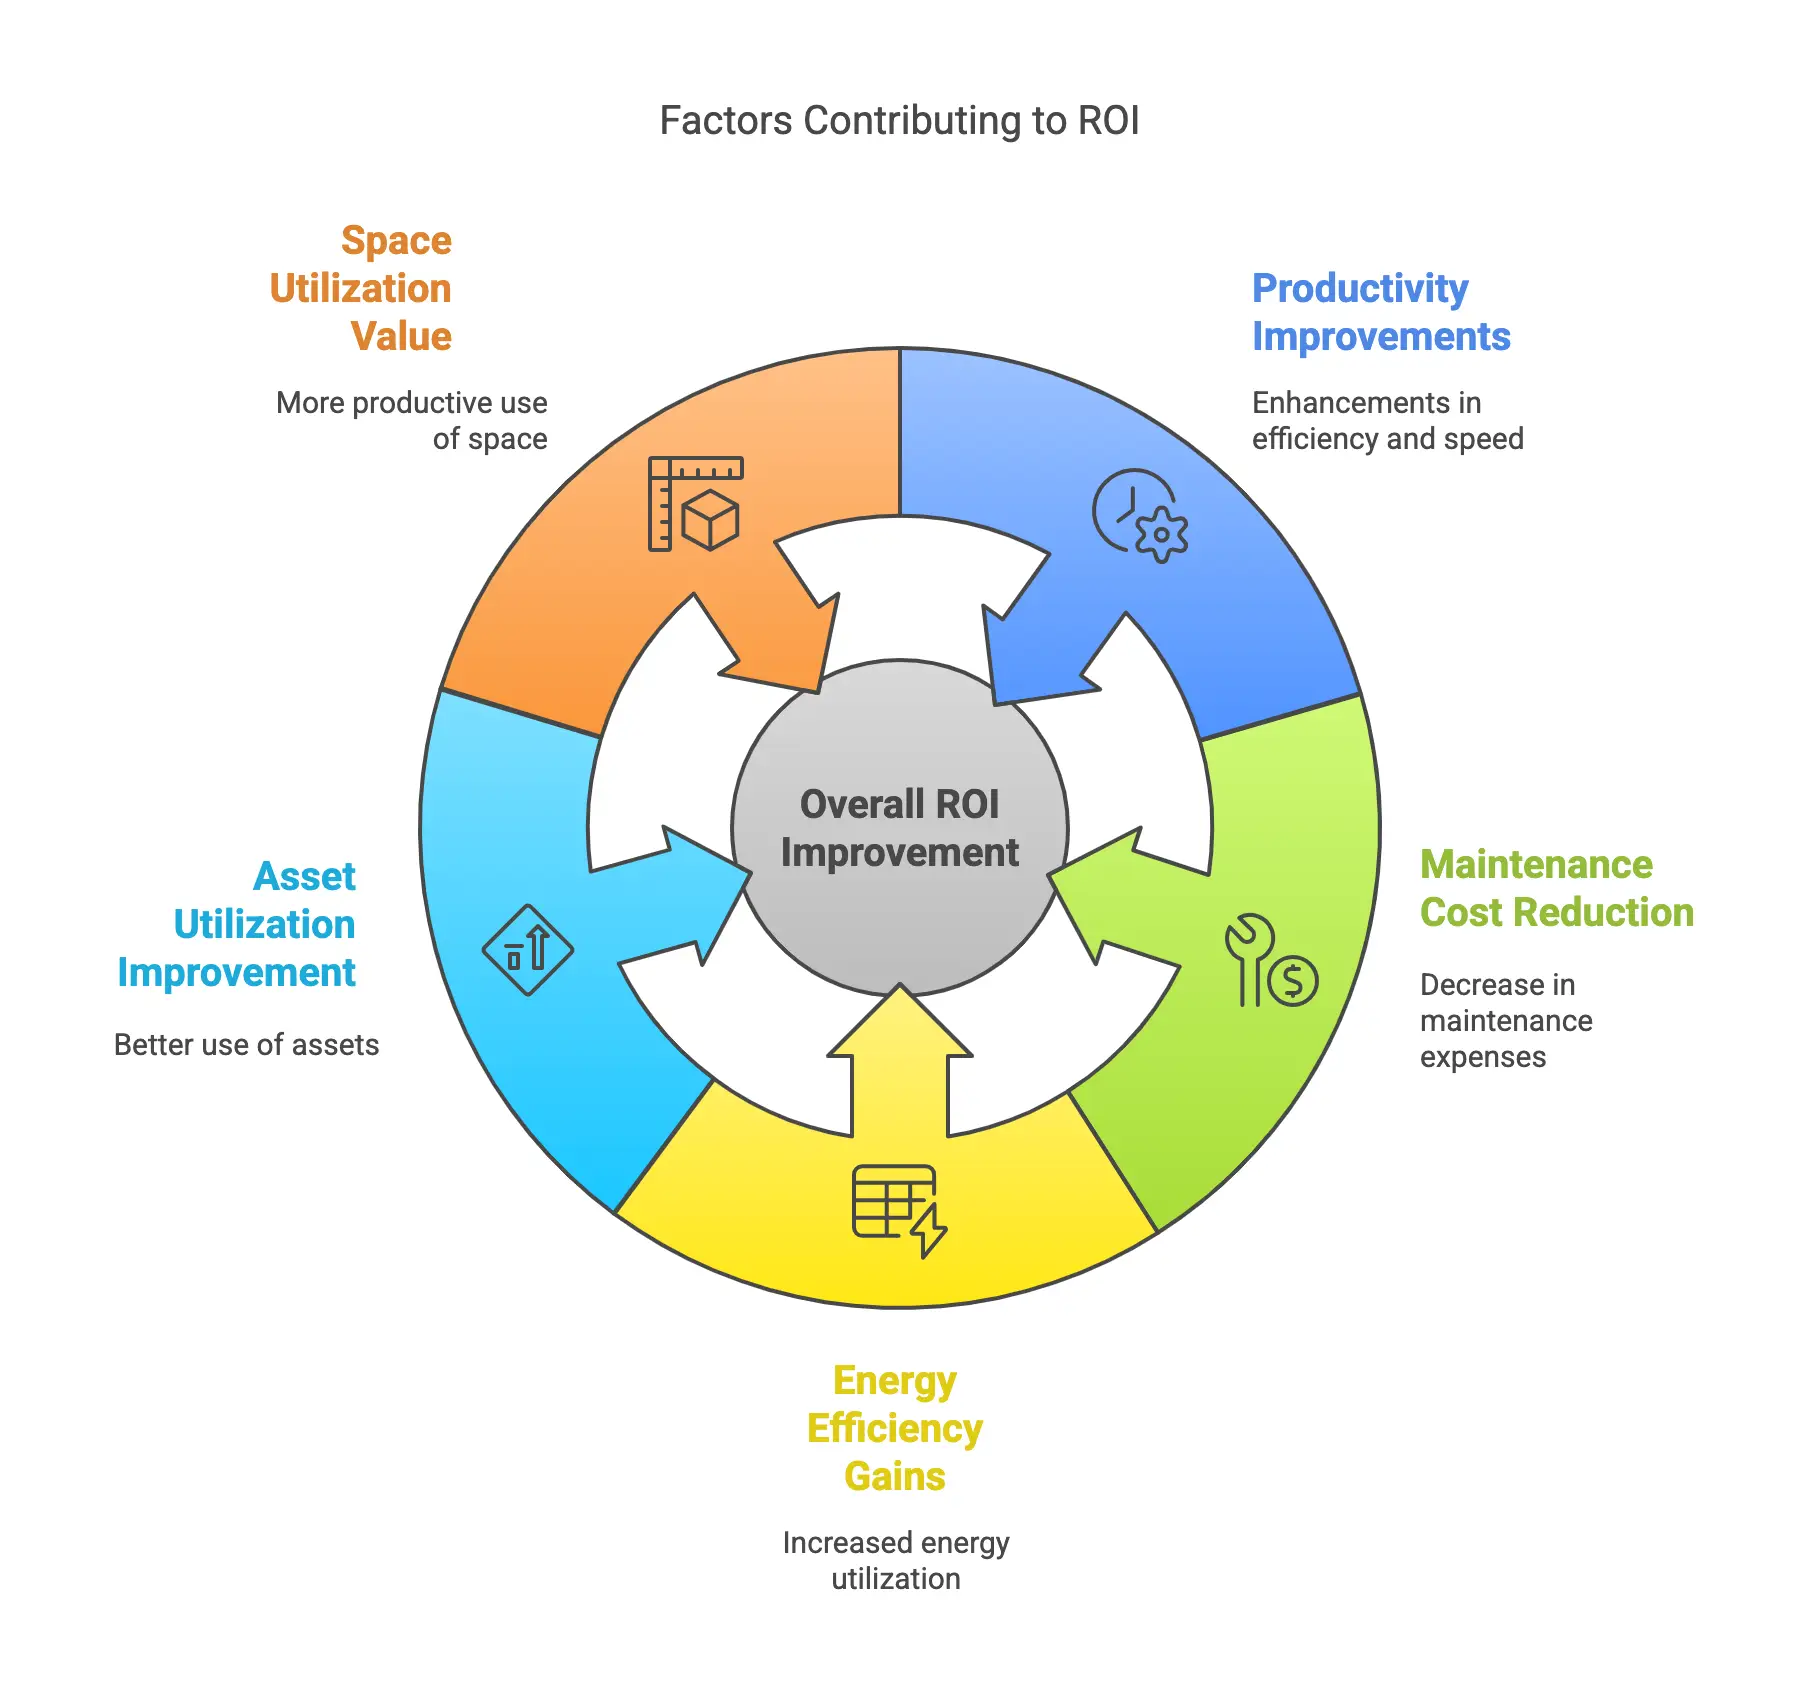
While direct cost savings are significant, our ROI calculator also quantifies indirect benefits that contribute to the overall return:
Productivity Improvements
- Eliminated Battery Swapping: 15-30 minutes saved per truck per day in multi-shift operations
- Consistent Power Delivery: No performance degradation as battery discharges
- Reduced Operator Fatigue: Less time spent managing power issues
- Faster Acceleration: Lithium batteries provide full power instantly, improving cycle times
Maintenance Cost Reduction
- Zero Watering Requirements: Eliminates 10-15 minutes of weekly maintenance per battery
- No Equalizing Charges: Saves 8-10 hours of downtime monthly for lead-acid battery maintenance
- Eliminated Terminal Cleaning: No corrosion issues that typically require regular maintenance
- Reduced Truck Repairs: Consistent power delivery reduces stress on drive motors and controllers
Energy Efficiency Gains
- Charging Efficiency: Lithium batteries achieve 95-98% charging efficiency compared to 75-80% for lead-acid
- No Overcharging: Battery management systems prevent wasted energy
- Regenerative Braking: More efficient energy recapture during braking and lowering operations
- Lower HVAC Costs: Reduced heat generation during charging means less cooling required
Asset Utilization Improvement
- Single Battery Operation: One lithium battery replaces 2-3 lead-acid batteries per truck
- Extended Lifespan: 2,500-4,000 cycles for lithium vs. 1,000-1,500 for lead-acid
- Higher Uptime: 30% average improvement in equipment availability
- Reduced Fleet Size Requirements: Higher availability can reduce the total number of trucks needed
Space Utilization Value
- Battery Room Elimination: Typically 200-500 square feet reclaimed for productive use
- Charging Infrastructure: Decentralized charging eliminates dedicated charging areas
- Ventilation Systems: Reduced or eliminated requirements for specialized ventilation
- Safety Equipment: Elimination of eyewash stations, acid spill kits, and other safety equipment
The Risk-Free Assessment Process
While this article provides a framework for understanding lithium battery ROI, every operation has unique characteristics that affect the precise financial returns. Rather than relying on general estimates, our team offers comprehensive, personalized ROI assessments tailored to your specific operation.
Our assessment process includes:
- Operational Analysis: We evaluate your current fleet usage patterns, shift structure, and power requirements
- Facility Assessment: Our specialists review your electrical infrastructure, space utilization, and charging location options
- Cost Modeling: We develop detailed projections of current costs vs. lithium implementation costs
- Custom ROI Timeline: Based on your specific parameters, we provide a precise projection of when you'll achieve ROI
- Implementation Roadmap: For operations ready to move forward, we create a phased transition plan that minimizes disruption
For qualified operations, we can even provide a risk-free trial of a battery/charger system with fleet monitoring software so you can validate the projected savings in your actual environment before making a full commitment.
Ready to Calculate Your ROI?

The assessment is completely free and carries no obligation. Our goal is to help you make an informed decision based on data specific to your operation.
Ready to discover your potential savings? Complete our simple assessment request form to schedule your free ROI analysis with one of our lithium battery specialists. We'll help you determine if lithium technology is the right investment for your specific operational needs and provide a clear timeline for when you can expect to see returns on your investment.
Get the latest news right in your inbox


